


The 2015 RISC OS Survey
This survey was run by RISCOSitory on the RISC OS Awards website, alongside the awards poll covering the same year. Apart from the initial receipt of the entries being on a Windows computer, all processing was carried out on an ARMX6 running RISC OS, using some internal software along with Fireworkz, PipeDream, Draw, Artworks2 and ConvImgs.
The idea of combining a survey with an annual awards poll should, in theory, provide a picture of how the RISC OS community looks, and allow developers and companies involved in the RISC OS platform to keep what they offer relevant - especially considering that it is an undeniable fact that the number of RISC OS users is low in the extreme.
With that in mind, as mentioned in the 2015 Awards results, the number of valid votes was 161, and while that's still only a small number, it's a significant improvement on 2014, which saw only around 100 voting/survey forms submitted - although the method of voting in the Awards Poll may have put people off last year. It also improves very slightly on the previous year, which saw around 150 votes.
Not everybody who voted in the Awards Poll completed the survey part of the form - leaving the default "I'd rather not say" option ticked instead - and some people left that option selected for some questions. That means no question saw a full 161 people answer it, and some questions saw fewer answers than others. The results are based only on those who offered an answer to each question.
The low number of entries overall means these results may not be statistically significant, and at the same time the sharp increase in numbers since the 2014 survey - around 60% - means any change in numbers could be a result of the many different additional people taking part, rather than reflect a change in habits or useage, and so on. That said, the +/- value given in brackets reflects the increase or decrease in percentage compared with the previous survey.
The third column in each table is the number of percentage points the result has changed by since the previous year.
The 2015 RISC OS Survey Results
Question 1: How many RISC OS systems do you own?
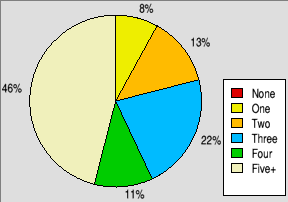
Typical numbers of RISC OS computers owned.
| Number | Percentage | Change |
|---|---|---|
| None | 0% | - |
| One | 8% | +1% |
| Two | 13% | -3% |
| Three | 22% | +3% |
| Four | 11% | -5% |
| Five+ | 46% | +4% |
Question 2: And of those, how many are in regular or semi-regular use?
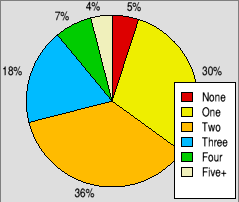
Typical numbers of RISC OS computers in use.
| Number | Percentage | Change |
|---|---|---|
| None | 5% | - |
| One | 30% | - |
| Two | 36% | +4% |
| Three | 18% | -6% |
| Four | 7% | - |
| Five+ | 4% | +2% |
Question 3: Which version of RISC OS do you use most?
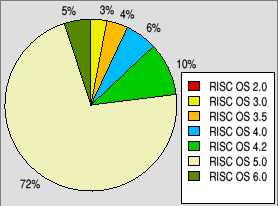
The most used versions of RISC OS.
| Version | Percentage | Change |
|---|---|---|
| RISC OS 2.0 | 0% | - |
| RISC OS 3.0 | 3% | -1% |
| RISC OS 3.5 | 4% | +1% |
| RISC OS 4.0 | 6% | -1% |
| RISC OS 4.2 | 10% | +2% |
| RISC OS 5.0 | 72% | +4% |
| RISC OS 6.0 | 5% | -5% |
Question 4: What is your main platform for using RISC OS?
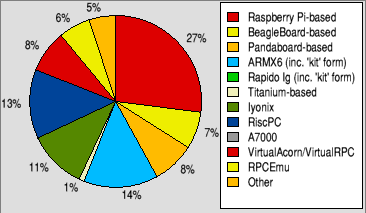
The platforms used most for RISC OS.
| Platform | Percentage | Change |
|---|---|---|
| Raspberry Pi-based | 27% | +7% |
| BeagleBoard-based | 7% | -6% |
| Pandaboard-based | 8% | -5% |
| ARMX6 (inc. 'kit' form) | 14% | +14% |
| RapidO Ig (inc. 'kit' form) | 0% | - |
| Titanium-based | 1% | +1% |
| IyonixPC | 11% | -7% |
| RiscPC | 13% | -1% |
| A7000 | 0% | - |
| VirtualAcorn/RiscPC | 8% | - |
| RPCEmu | 6% | -3% |
| Other | 5% | - |
Question 5: How long have you been a RISC OS user?
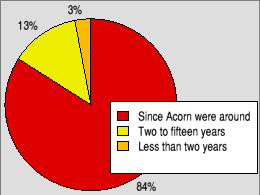
How long people have been RISC OS users.
| How long | Percentage | Change |
|---|---|---|
| Since Acorn were around | 84% | -4% |
| Two to fifteen years | 13% | +2% |
| Less than two years | 3% | +2% |
Question 6: Do you use RISC OS in a professional capacity in any way?
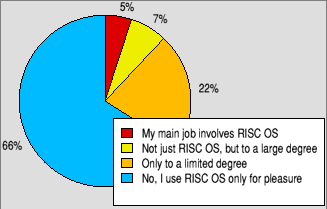
Breakdown of the use of RISC OS
in a professional capacity.
| Degree of professional use | Percentage |
|---|---|
| My main job involves RISC OS | 5% |
| Not just RISC OS, but to a large degree | 7% |
| Only to a limited degree | 22% |
| No, I only use it for pleasure | 66% |
Question 7: Would you say your overall use of RISC OS has increased or decreased over the last year?
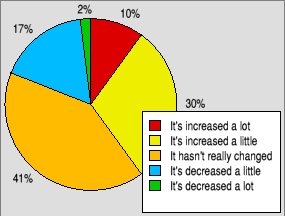
Breakdown of whether people's use of RISC OS has increased or decreased.
| Increase/decrease in use | Percentage |
|---|---|
| It's increased a lot | 10% |
| It's increased a little | 30% |
| It hasn't really changed | 41% |
| It's decreased a little | 17% |
| It's decreased a lot | 2% |
Question 8: Do you attend your local user group meetings?
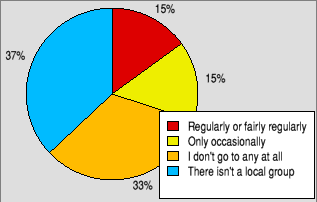
Breakdown whether people attend user group meetings.
| Meeting attendance | Percentage |
|---|---|
| Regularly or fairly regularly | 15% |
| Only occasionally | 15% |
| I don't go to any at all | 33% |
| There isn't a local group | 37% |
Question 9: If not, do you know of a local group and if/when they meet?
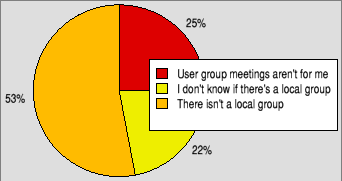
Why people don't attend local user group meetings
| Reason for non-attendance | Percentage |
|---|---|
| Meetings aren't for me | 25% |
| I don't know if there's a local group | 22% |
| There isn't a local group | 53% |
Question 10: By choice, do you use any platforms other than RISC OS?
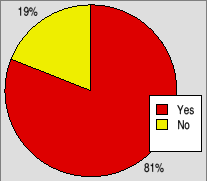
Whether people choose to use
another OS as well as RISC OS
| Yes or no | Percentage | Change |
|---|---|---|
| Yes | 81% | +6% |
| No | 19% | -6% |
Question 11: If so, which operating system?
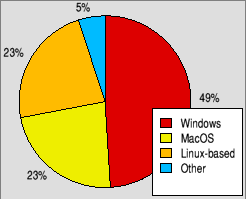
The other OS most used by choice.
| Most used other OS | Percentage | Change |
|---|---|---|
| Windows | 49% | -7% |
| MacOS | 23% | +11% |
| Linux-based | 23% | -3% |
| Other | 5% | -1% |
Question 12: On what processor do you use that operating system?
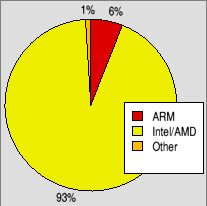
The processors used for the other
operating system.
| Processor used | Percentage | Change |
|---|---|---|
| ARM | 6% | +1% |
| Intel/AMD | 93% | +2% |
| Other | 1% | -3% |
Question 13: And do you use it more than RISC OS?
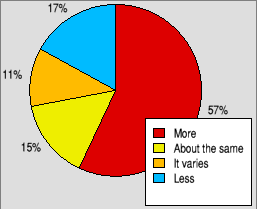
Is that other OS used more or less than RISC OS?
| Amount used | Percentage | Change |
|---|---|---|
| More than RISC OS | 57% | +16% |
| About the same | 15% | -14% |
| It varies | 11% | +11% |
| Less than RISC OS | 17% | -13% |
Question 14: In which age range do you fall?
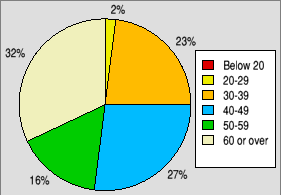
The age of RISC OS users.
| Age range | Percentage | Change |
|---|---|---|
| Below 20 | 0% | - |
| 20-29 | 2% | +1% |
| 30-39 | 23% | +6% |
| 40-49 | 27% | +4% |
| 50-59 | 16% | +3% |
| 60 or over | 32% | -14% |
Question 15: Are you male or female?
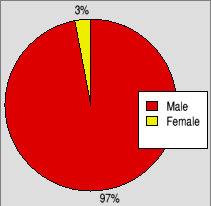
Are RISC OS users male or female?
| Gender | Percentage | Change |
|---|---|---|
| Male | 97% | - |
| Female | 3% | - |