


The 2014 RISC OS Survey
This was the second survey run by RISCOSitory on the new RISC OS Awards website, alongside the 2012/2013 awards poll. Apart from the initial receipt of the entries being on a Windows computer, the original processing was carried out on a Raspberry Pi running RISC OS, using Fireworkz, Draw, Artworks2, and ConvImgs. The pie charts have since been updated on an ARMX6, using PipeDream, Draw, Artworks2, and ConvImgs, and the way the numbers have been presented has also been changed.
The idea of combining a survey with an annual awards poll should, in theory, provide a picture of how the RISC OS community looks, and allow developers and companies involved in the RISC OS platform to keep what they offer relevant - especially considering that it is an undeniable fact that the number of RISC OS users is low in the extreme.
With that in mind, as mentioned in the Awards results, at around 100 the number of people who voted in the awards and took part in the survey was significantly lower than the previous one. The RISC OS community isn't a large one, which is an obvious factor in low numbers in generally, and for this particular year it is likely that people were put off taking part due to the nature of the Awards Poll, which didn't offer any options this time, and instead allowed people to suggest categories.
Despite the low number of entries, though, compiling the results into meaningful figures still needed to be done - but it needs to be stressed that the number of survey results completed is low enough that it may not be statistically representative - even less so than it was for the 2012/13 result.
In general, however, while not everyone who took part answered every question, instead leaving the "I'd rather not say" option selected, the number doing this for each question was very low. These are obviously not counted in the results below.
Update (August 2020): As noted above, the way the results are presented has been changed. Firstly, the various charts, following a change of procedure in subsequent years; these are now produced from PipeDream, rather than Fireworkz, because it seems to generate smaller images but with slightly larger text. Secondly, the percentages have now been rounded, rather than shown to two decimal places. And thirdly, the various options and percentages are now presented in tables, which makes them easier to read. Finally, any accompanying text has been removed from each option.
The third column in each table is the number of percentage points the result has changed by since the previous year.
The 2014 RISC OS Survey Results
Question 1: How many RISC OS systems do you own?
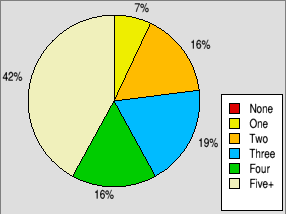
Typical numbers of RISC OS computers owned.
| Number | Percentage | Change |
|---|---|---|
| None | 0% | -1% |
| One | 7% | -1% |
| Two | 16% | -2% |
| Three | 19% | -1% |
| Four | 16% | -1% |
| Five+ | 42% | +6% |
Question 2: And of those, how many are in regular or semi-regular use?
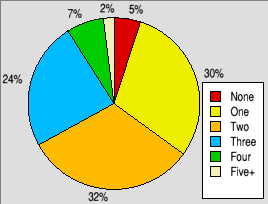
Typical numbers of RISC OS computers in use.
| Number | Percentage | Change |
|---|---|---|
| None | 5% | -2% |
| One | 30% | +3% |
| Two | 32% | +3% |
| Three | 24% | +1% |
| Four | 7% | -2% |
| Five+ | 2% | -3% |
Question 3: Which version of RISC OS do you use most?
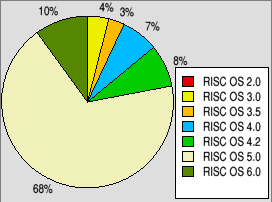
The most used versions of RISC OS.
| Version | Percentage | Change |
|---|---|---|
| RISC OS 2.0 | 0% | - |
| RISC OS 3.0 | 4% | +3% |
| RISC OS 3.5 | 3% | - |
| RISC OS 4.0 | 7% | - |
| RISC OS 4.2 | 8% | -6% |
| RISC OS 5.0 | 68% | +3% |
| RISC OS 6.0 | 10% | - |
Question 4: What is your main platform for using RISC OS?
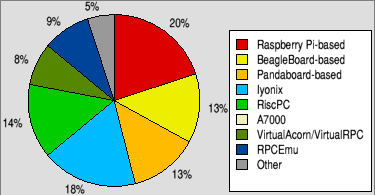
The platforms used most for RISC OS.
| Platform | Percentage | Change |
|---|---|---|
| Raspberry Pi-based | 20% | -2% |
| BeagleBoard-based | 13% | -2% |
| Pandaboard-based | 13% | +3% |
| IyonixPC | 18% | -1% |
| RiscPC | 14% | -6% |
| A7000 | 0% | -1% |
| VirtualAcorn/RiscPC | 8% | -1% |
| RPCEmu | 9% | +8% |
| Other | 5% | +2% |
Question 5: How long have you been a RISC OS user?
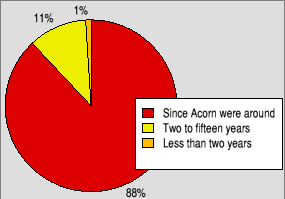
How long people have been RISC OS users.
| How long | Percentage | Change |
|---|---|---|
| Since Acorn were around | 88% | +4% |
| Two to fifteen years | 11% | -3% |
| Less than two years | 1% | -1% |
Question 6: By choice, do you use any platforms other than RISC OS?
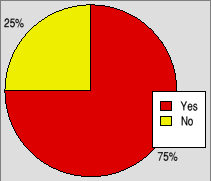
Whether people choose to use
another OS as well as RISC OS
| Yes or no | Percentage | Change |
|---|---|---|
| Yes | 75% | -15% |
| No | 25% | +15% |
Question 7: If so, which operating system?
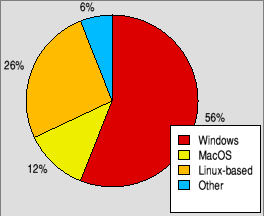
The other OS most used by choice.
| Most used other OS | Percentage | Change |
|---|---|---|
| Windows | 56% | +3% |
| MacOS | 12% | -5% |
| Linux-based | 26% | - |
| Other | 6% | +2% |
Question 8: On what processor do you use that operating system?
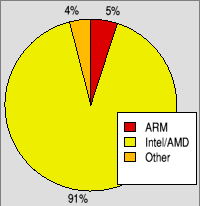
The processors used for the other
operating system.
| Processor used | Percentage | Change |
|---|---|---|
| ARM | 5% | -2% |
| Intel/AMD | 91% | - |
| Other | 4% | +2% |
Question 9: And do you use it more than RISC OS?
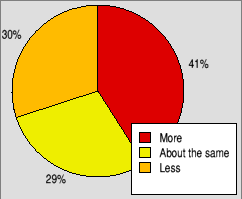
Is that other OS used more or less than RISC OS?
| Amount used | Percentage | Change |
|---|---|---|
| More than RISC OS | 41% | - |
| About the same | 29% | - |
| Less than RISC OS | 30% | - |
Question 10: In which age range do you fall?
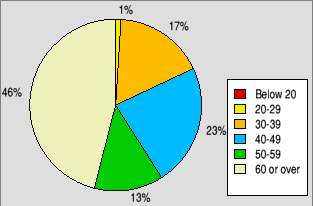
The age of RISC OS users.
| Age range | Percentage | Change |
|---|---|---|
| Below 20 | 0% | - |
| 20-29 | 1% | -5% |
| 30-39 | 17% | - |
| 40-49 | 23% | +1% |
| 50-59 | 13% | -3% |
| 60 or over | 46% | +7% |
Question 11: Are you male or female?
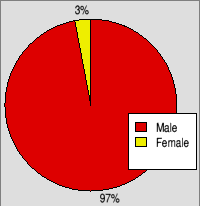
Are RISC OS users male or female?
| Gender | Percentage | Change |
|---|---|---|
| Male | 97% | -2% |
| Female | 3% | +2% |